

Every marketing team today wants to make smart, data-driven decisions. But there’s a harsh truth many learn too late. Building a data driven marketing infrastructure is like constructing a building. Some organizations need only a simple ranch house, while others require the equivalent of the Empire State Building.
The costs and complexity between these options differ by orders of magnitude. Getting it wrong can waste millions and leave you unable to answer basic marketing questions.
This guide will help you determine what your organization actually needs, how to scale appropriately, and how to ensure you get measurable returns on your investment. We’ll examine real-world case studies from companies that got it right—and some cautionary tales from those who didn’t.
Understanding Your Data Infrastructure Requirements
Before investing in sophisticated marketing analytics systems or an enterprise data warehouse, you need to understand exactly what you’re trying to build and why.
The Two Critical Dimensions
Your data infrastructure needs are primarily determined by two factors:
- Customer Base Size: The number of customers directly impacts data volume. A business with 100,000 customers will have substantially different requirements than one with 100 million.
- Complexity of Requirements: The types of questions you need to answer and the business problems you’re trying to solve determine how intricate your data models need to be.
These dimensions create a spectrum of possibilities from simple to highly complex:
| Size/Complexity | Small (100K Customers) | Medium (1M Customers) | Large (100M+ Customers) |
|---|---|---|---|
| Low Complexity | Basic tools like Excel | Server-based analytics | Appliance computing |
| High Complexity | Small data warehouse | Medium office building | Empire State Building |
Real-World Examples at Different Scales
A regional retailer with 10 stores and 100,000 customers may need only 1 terabyte of data storage for basic sales analysis. The infrastructure might cost between $50,000-$250,000.
By contrast, National Australia Bank, with millions of customers, scans 2.7 million customer events daily, identifying over 3 million opportunities annually for its personal bankers. Their system required a centralized enterprise data warehouse combining data from multiple business functions.
The key is knowing where your organization sits on this spectrum of data silos and starting with appropriate technology to optimize marketing.
The Marketing Data Continuum: From Excel to Enterprise
Every organization sits somewhere on a continuum of data capabilities, and understanding where you are now and where you need to go is crucial for planning.
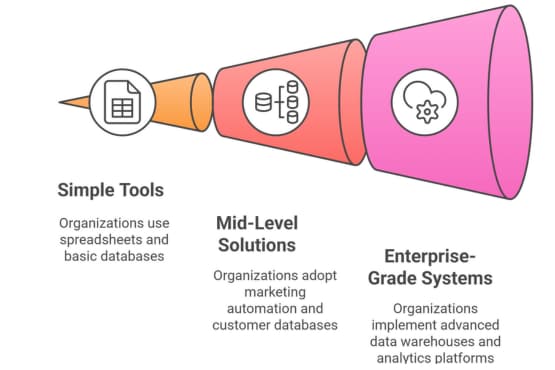
Stage 1: Simple Tools for Basic Analysis
Many marketing teams start with spreadsheets and basic databases. When your data is small and your questions are straightforward, this approach works well:
- Analyzing sales trends across a limited product line
- Basic customer segmentation by geography or purchase frequency
- Simple ROI calculations for campaigns
A specialty retailer with several hundred stores discovered Excel was sufficient for their initial needs when analyzing point-of-sale data to determine which products needed restocking. However, as they expanded to over 500 stores, the limitations became apparent.
Stage 2: Mid-Level Solutions
As your data grows in volume or complexity, you’ll likely need more robust tools:
- Marketing automation platforms
- Customer databases
- Server-based analytics solutions
These systems handle larger data volumes and provide more sophisticated analysis, but they’re still manageable without massive IT investment.
Stage 3: Enterprise-Grade Systems
Large organizations with millions of customers and complex analytical needs require enterprise-level solutions:
- Enterprise data warehouses (EDW)
- Data lake architectures
- Advanced analytics platforms
DIRECTV’s customer retention system processes 60 million transactions daily, identifying at-risk subscribers and generating retention leads every 15 minutes.
This near real-time system allows them to contact potential defectors within three hours with special retention offers. The result? They save 25% of these at-risk subscribers, reducing their annual churn rate from 19% to 16%—translating to over $500 million in retained revenue each year.
How to Decide What You Need
To determine where your organization should be, ask yourself:
- How many customers do we have, and how much data do they generate?
- What business questions do we need to answer?
- How quickly do we need insights (real-time vs. periodic)?
- What’s our budget reality?
Remember: you can incrementally upgrade without unnecessary investment. Start with the minimum viable solution that solves your immediate problems, but design with future growth in mind.
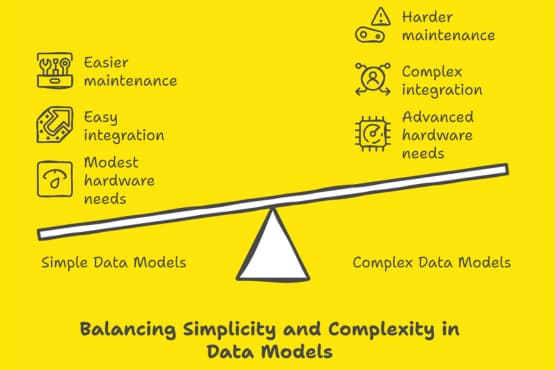
Data Relationship Models: Simple vs. Complex
The complexity of your data relationships dramatically impacts the infrastructure you’ll need. Let’s examine the difference between simple and complex models.
Basic Relationship Models
A simple retail sales data model might look like this:
- Central fact table (Sales)
- Four dimensions: Product, Customer, Store, and Date
This straightforward star schema allows you to answer basic questions like:
- Which products are selling best in which stores?
- What are our sales trends over time?
- How do different customer segments purchase?
This model can run efficiently on modest hardware and doesn’t require complex integration for data analytics purposes.
When Complexity Becomes Necessary
As your business questions grow more sophisticated, so must your data models. A complex model for customer lifetime value (CLTV) analysis might include:
- Multiple fact tables (Orders, Payments, Customer Interactions)
- Numerous dimensions (Product, Customer, Location, Channel, Employee)
- Complex relationships between entities
This model allows for deeper questions such as:
- What is the lifetime value of each customer segment?
- How do multichannel interactions affect purchase behavior?
- Which employees drive the most profitable customer relationships?
The National Australia Bank example shows how complex data models enable sophisticated event-driven marketing.
By integrating customer account data, their system detected significant events—like a large deposit into a non-interest-bearing account—triggering a banker to call within 24 hours. This approach resulted in a 40% offer acceptance rate.
Creating Scalable Relationship Frameworks
When designing your data relationships, follow these principles:
- Start with business questions first, then design models to answer them
- Document all entity relationships clearly
- Plan for future expansion of both data volume and relationship complexity
- Test models with sample data before full implementation
- Get input from both business users and technical experts
Remember that overly complex models carry risks too—they’re harder to maintain, more prone to errors, and often slower to query.
Aim for the minimum complexity needed to solve your current business problems.
The Data Warehouse Decision: Build or Wait?
One of the biggest decisions organizations face is when to invest in a formal data warehouse. This isn’t a decision to take lightly.
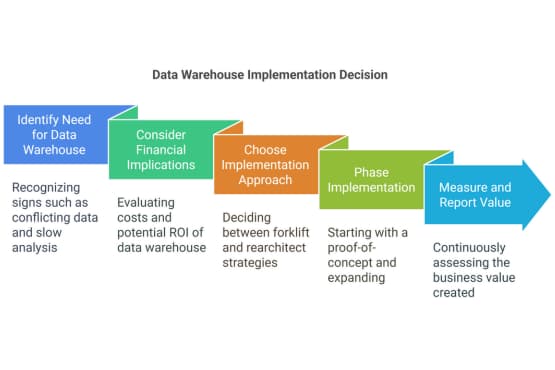
Signs You Need a Data Warehouse
Consider a data warehouse when:
- You’re struggling to get a unified view of customer behavior
- Analysis takes too long using current systems, hindering effective data analytics.
- Different departments have conflicting data about the same metrics
- You need to combine data from 5+ source systems
- Historical analysis beyond 12-18 months is important
In the DIRECTV case, building a data warehouse became necessary when they needed to predict which customers might cancel service before it happened.
This required integrating data from billing, viewing habits, customer service interactions, and technical support logs—something impossible with siloed systems.
Financial Considerations
Data warehouse implementations typically cost:
- Small implementations: $250,000-$500,000
- Mid-sized projects: $500,000-$2.5 million
- Enterprise-scale: $5 million to $100+ million
However, when properly aligned with business objectives, the returns can be substantial. The ROI template from the research shows how analytical marketing can deliver a 45.8% internal rate of return with a net present value of $4.9 million for a hypothetical company with 400,000 customers.
Forklift vs. Rearchitect: The Critical Choice
When implementing a data warehouse, you face a crucial decision:
- Forklift approach: Simply moving existing databases into a consolidated environment without redesigning
- Rearchitect approachRedesigning your data model to optimize marketing strategies for analysis.
In 1995, Continental Airlines consolidated 45 different databases into a single enterprise data warehouse, saving $5 million annually in reduced maintenance costs.
However, simply moving the databases without restructuring meant they couldn’t answer complex business questions.
The research shows that rearchitecting, while more expensive initially, can deliver up to 300% more NPV benefit compared to the forklift approach.
This is because a properly designed analytical structure allows you to answer questions that siloed databases cannot.
How to Phase Implementation
Rather than attempting a “big bang” implementation, consider this phased approach:
- Start with a proof-of-concept solving one high-value business problem
- Document clear ROI from this initial project
- Use this success to secure funding and support for expansion
- Add new data sources and capabilities incrementally
- Continuously measure and report on business value created
A specialty grocery chain with hundreds of stores wanted to reduce product stockouts.
Rather than building a complete enterprise system immediately, they started by analyzing point-of-sale data from 50 stores to prove the concept. The success of this pilot secured funding for the full rollout.
Real-World Success Story: Customer Retention Systems
DIRECTV provides one of the most compelling examples of ROI from marketing data infrastructure. With $17 billion in annual revenues and over 18 million U.S. customers, they faced significant challenges with customer churn.
The Challenge and Solution
DIRECTV was losing valuable subscribers at an alarming rate. They implemented an automated system that enabled near real-time data collection and analysis. This system:
- Processes 60 million transactions daily
- Runs predictive “save” models every 15 minutes
- Identifies customers likely to cancel before they call to do so
- Generates leads for the Save Team who contact these customers within three hours
- Offers personalized retention packages based on customer value and risk level
Measurable Results
The business impact was substantial:
- 25% of at-risk subscribers were saved from discontinuing service
- Overall churn rate dropped from 19% to 16% annually
- This 3% reduction in churn translated to over $500 million in saved revenue annually, showcasing the effectiveness of data-driven marketing.
Infrastructure Components
This successful system required several key components, including data science techniques.
- Real-time data integration from multiple source systems
- A central enterprise data warehouse is essential for integrating third-party data and optimizing marketing efforts.
- Predictive modeling capabilities in data-driven marketing enhance decision-making.
- Integration with call center systems
- Automated lead generation and prioritization
Key Lessons for Trade Marketers
For trade marketers working with retail partners, DIRECTV’s approach offers valuable lessons:
- Identify early warning signals of partner disengagement
- Create a structured process for intervention
- Develop data-driven offers tailored to partner value
- Measure and refine your approach continuously
Event-Driven Marketing Infrastructure
Another powerful approach is event-driven marketing, which responds to customer behavior in real-time rather than through scheduled campaigns.
National Australia Bank’s Approach
National Australia Bank (NAB) pioneered event-driven marketing in financial services. Their system:
- Scans 2.7 million customer events daily
- Identifies over 3 million annual opportunities
- Makes 500,000 outbound marketing calls with a 40% take rate
One striking example: when a customer deposited $160,000 in a non-interest-bearing account, the system flagged this unusual activity.
A personal banker called within 24 hours and discovered it was startup money for a new business. This single call resulted in a new business checking account, credit card, and line of credit, demonstrating effective digital marketing.
After acquiring banks in Europe, NAB applied these principles to consolidate customer data, resulting in:
- 3,000% improvement in response rates to marketing offers
- 17% reduction in customer churn
- 20% increase in marketing take rates
- 15% increase in lead conversion
Technology Requirements for Real-Time Response
To implement event-driven marketing, you need infrastructure that supports:
- Real-time data capture from all customer touchpoints
- Event processing engines to identify significant triggers can enhance data-driven marketing efforts.
- Decision systems that determine appropriate responses
- Integration with customer-facing channels
- Closed-loop measurement to track results
Cross-Channel Integration
The real power comes from coordinating responses across channels:
- Call center representatives have customer context when they call
- Website experiences reflect recent interactions
- Email communications reference in-store behavior
- Mobile messages arrive at relevant moments
This coordination requires a central data repository and consistent customer identification across marketing channels.
Common Pitfalls in Data Infrastructure Projects
Research from the Standish Group indicates that 72% of IT projects fail to deliver as planned. Here are the most common pitfalls in marketing data infrastructure projects and how to avoid them.
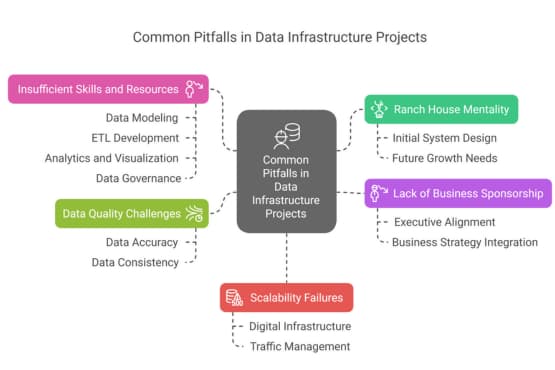
The “Ranch House Mentality”
Many organizations underestimate future needs, building systems that work initially but cannot scale. The analogy from the research is apt: they start building a ranch house when they’ll eventually need the Empire State Building.
A specialty grocery chain built a system that worked beautifully for analyzing one store’s worth of data but collapsed when asked to process information from hundreds of locations. The IT team had designed with current needs in mind without considering growth.
Lack of Business Sponsorship
Without executive support, data infrastructure projects often stall or fail. In one Fortune 500 company, executives approved a $30 million data warehouse but never defined what business questions it needed to answer.
The result was an impressive technical achievement that failed to meet business needs due to a lack of alignment with marketing strategies.
Data Quality Challenges
Poor data quality can undermine even the best-designed systems. One company analyzed 70 systems containing customer data and found they had 200 million customer IDs for just 20 million actual customers!
Continental Airlines tried to send birthday cards to high-value customers but discovered they had been tracking acquisition dates rather than birthdates since the 1990s, resulting in significant data gaps.
Insufficient Skills and Resources
Building and maintaining marketing data infrastructure requires specialized expertise. Organizations often underestimate the knowledge required for:
- Data modeling and warehouse design
- ETL (Extract, Transform, Load) development
- Analytics and visualization
- Data governance
Scalability Failures
AT&T’s mLife campaign during the 2001 Super Bowl demonstrates the dangers of scalability failures. After spending over $20 million on TV ads, their website crashed due to high traffic volumes. The marketing team hadn’t coordinated with IT to ensure the digital marketing infrastructure could handle the expected response.
Conclusion and Action Plan
Building the data driven marketing infrastructure isn’t about having the latest technology—it’s about creating a foundation that enables you to answer critical business questions and drive measurable value.
Summary of Key Insights
- Your data infrastructure needs depend on both customer base size and requirement complexity
- Start with business questions, then design systems to answer them
- Incremental implementation with clear ROI measurement is the safest approach
- Executive sponsorship and proper scoping are critical success factors for successful marketing campaigns.
- Data quality and governance matter as much as technical infrastructure
5-Point Action Plan
- Assess your current position: Map your organization on the complexity/size matrix to understand where you stand
- Define business requirements: Document the specific questions you need to answer and decisions you need to support
- Start small but plan big: Begin with focused projects that deliver measurable value, but design with future growth in mind
- Build the business case: Calculate expected ROI using metrics like improved conversion rates, reduced churn, or increased efficiency
- Secure executive sponsorship: Ensure business leaders understand the value and remain engaged throughout implementation
Final Thoughts
The competitive advantage of proper marketing data infrastructure isn’t just in having better technology—it’s in using data analytics to make better decisions faster than your competitors. As Harrah’s Entertainment proved, starting small with clear business cases for each infrastructure investment can eventually create a powerful competitive advantage that’s difficult for others to replicate.
Whether you need a ranch house or the Empire State Building, the key is understanding your requirements, building incrementally, and measuring results at every step. Your marketing data infrastructure should grow alongside your business, providing increasing value without requiring complete rebuilds along the way.
By understanding the principles in this guide, you’ll be better equipped to avoid costly mistakes and create a data foundation that truly serves your organization’s marketing needs.